Overview
I came to the conclusion that if one were to assume a consistent set of teammates and other external circumstances – it would then be possible to predict a player’s three point shooting performance by measuring prior performance and applying anticipated trends. A large part of the solution I came up with involves adjusting three point shooting statistics based on a statistical estimate of the quality of a player’s three point shot attempts. By creating my new statistic – which I will call Adjusted Three Point Shooting Percentage (ATPSP) for the time being – we are given a more accurate view of a player’s pure three point shooting ability as exhibited during any given season.
Based on my assumptions, a successful formula involved taking into account the following factors: shot quantity – the more three point shots attempted, the tougher it is for a player to be selective in his shot attempts, and the tougher it is for a player to maintain a certain shooting percentage; minutes played - for example, a player averaging 20 minutes per game may only be given major minutes by his coach on nights he is “hot,” or he may only be given major minutes when a matchup is considered favorable, thereby skewing per-minute based and other percentage based stats in his favor; teammates and coaches – it is assumed that a player’s three point shooting percentage is benefited when a player is surrounded by other teammates who pass the ball well, present scoring threats to attract defensive attention, and play within a well designed offensive system; and shot selection – a player who is, overall, a more efficient offensive option than his teammates is more likely to attract increased defensive attention, making his shots more likely to be contested, while indirectly creating shot opportunities for his teammates (and vice versa).
Methodology
I started with a base formula of (3PT% * (3PA/MP)), and then multiplied by (1 + (.0075 * MPG)). This was a quick and easy and seemingly effective way to account for a player’s shot quantity, and the minutes per game adjustment seemed reasonable. Working with an historical spreadsheet and ignoring players receiving less than 11 minutes per game, this formula resulted in a list where those at the top – Dee Brown, Dennis Scott, Ray Allen, and George McCloud – seemed like they could arguably belong there. Even among those playing less than 11 minutes per game, names included only Voshon Lenard and Trevor Ruffin – again, very reasonable, especially considering that I had yet to make any team based or otherwise logical adjustments.
Next, the objective was to adjust players’ scores based on their respective teams. To do this, I aimed to create a formula to rank teams based on: 25% perceived overall offensive ability; 25% perceived passing ability; 25% perceived inside scoring ability; and 25% perceived three point shooting ability. The formula I decided on scores teams on a proportional scale to league-wide top performance in the following categories: Points Scored, accounting for 9.5 points; ORTG, also accounting for 9.5 points; Points Allowed, 3 pts; DRTG, 3 pts; AST/FGM, 25 pts; 2 Pt Shooting Percentage, 25 pts (“Close Shot FG%,” as gathered from 82games.com, was utilized for ’07-08 statistics); and (3PT% * 3PA/M), 25 pts.
Before determining exactly each team’s score would affect its players’ ATPSP, I aimed to come up with a measure of a player’s shot selection. After a lot of thought, I thought that one logical way to do this would be to compare a players TS% with his teammates’ TS%; theoretically, this would do a good job of determining the likelihood that a player’s shots came at the expense of more offensively efficient teammates. To prevent small sample sizes from skewing results, I ran the following formula - ((1 + (.005 * MPG)) * (1 + (GP / 820)) * TS%) – and then assigned each player a rank between 1 (lowest) and 10 (highest) based on where his adjusted TS% ranked among his teammates, and multiplied that number by a variable which represented each team’s overall offensive production (theoretically, a player who is the most efficient player on a very good offensive team is assumed to have had even better shot selection, or simply to have had more of an otherwise positive impact, than the most efficient player on a poor offensive team – and vice versa).
Then, to determine the exact degree of adjustments, I experimented a little. Once I got to a point where Joe Johnson’s three point shooting appeared to follow logical trends in recent years, and the old Antoine Walker appeared to be a relatively poor three point shooter, I stopped experimenting - after all I could always go back to experimenting if results didn’t look good. For team based adjustments, the top ranked team’s players were assigned a “multiplier” of 1.2, and calculations were made to assign other teams’ players a number in between 1.21 and about 2-2.4 based largely on how the team’s score compared to the best team’s score (and adjusted very slightly and consistently, subjectively, to account for potential year specific errors). This “team multiplier” was to be multiplied by a player’s existing ATPSP. For reference, the table below discloses the team multipliers I used for each NBA team over the past five seasons:
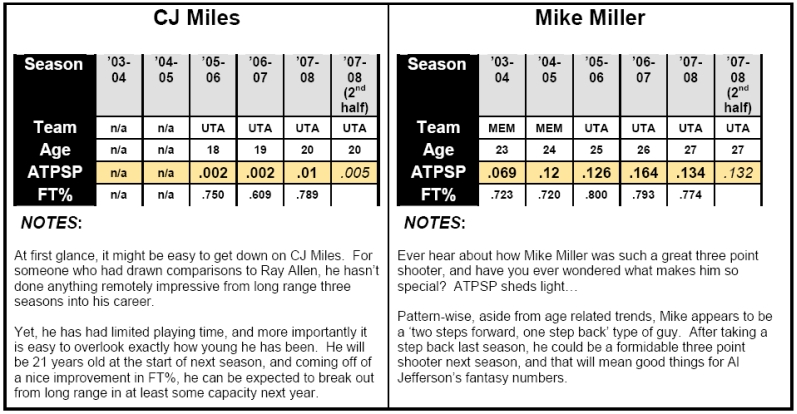
�Next, I took each player’s “team efficiency rank” and multiplied it by a variable approximately in between .09 and .126 depending on the team a player played for. This resulted in a minimum multiplier of .09 and a maximum multiplier of 1.26 to be multiplied by the player’s existing ATPSP. For recent seasons, this is the step where players such as Mike Miller, Ray Allen, Reggie Miller, and Peja Stojakovic tend to rise to the top of the list. Not coincidentally, this is also the step where Antoine Walker goes from looking like a decent or good three point shooter to looking like a poor to average one at best instead.
Then, I punished players who played less than 20 minutes per game (between 1 and 40+ percent, proportionate to how few minutes they played) and to a much lesser extent also punished those with less than 100 total three point shooting attempts. This was deemed necessary to prevent flaky results based on particularly small sample sizes.
The last step: I adjusted ATPSP per season. Over the past five seasons, statistically, three point shooting was more prominent in the NBA in ’07-08 than in any of the four previous seasons. Utilizing my base formula, the league-wide quality of three point shooting was nearly 27% worse in ’03-04 than in ’07-08, with differing figures in between. I assumed that half of the driving cause for this was a decrease in league-wide three point shooting talent, but it was reasonable to believe other rule and officiating based factors had also intervened. So, I adjusted yearly scores proportionately on a scale of 0-14% to compensate for this.
Projecting Three Point Shooting
Now to test the hypothesis, that once we have gotten this far, we can now do a reasonably good job at predicting trends in players’ three point shooting ability. After months of reviewing data, I have not come up with a set formula that I feel would work accurately for each player in the league, and I am not sure doing so would truly accomplish much. However, on a player by player basis, different players’ ATPSPs on a year by year basis often seem to follow graphical formulas, even if those graphical formulas are specific to a player and not to all players in the same age group. Taking this into account, in conjunction with other much more general trends which generally seem to apply to all NBA players, it does theoretically become possible to make relatively accurate (and partially subjective) predictions. In this sense, ATPSP works as a scouting tool.
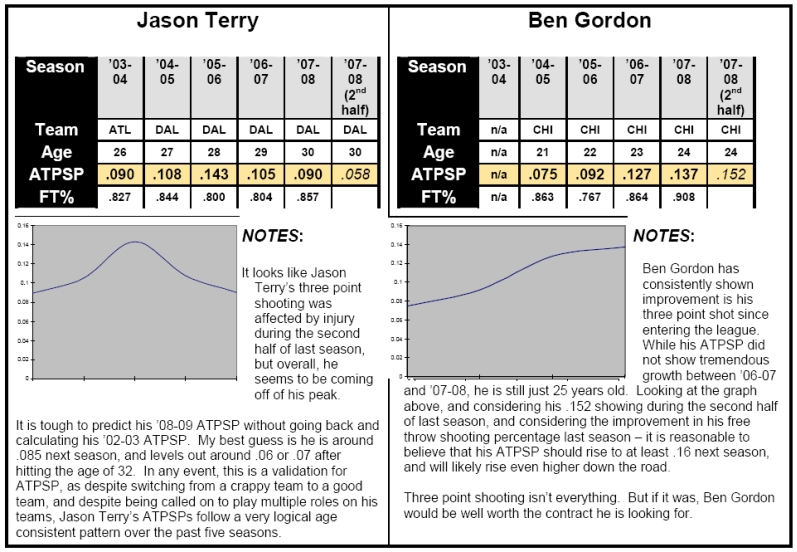
We will get into some player specific examples shortly, but for now I will elaborate on the more general trends that appear to affect all three point shooters. By analyzing both historical statistics dating back 20 years, and by analyzing league-wide ATPSP for the past five seasons, and by combining these analysis’ with subjective exploration, there were a few things that became absolutely clear without requiring overanalyzation. Among findings: good three point shooting performances by players under the age of 21 are rare, and are especially rare for those players that noticeably lack an NBA ready physique – therefore, seemingly poor ATPSPs from players under the age of 21 (at the start of a season) or noticeably physically undeveloped can still indicate a player worth keeping an eye on; players tend to show their greatest year by year improvement before the age of 23, but on average, continue improving before peaking between the ages of 27 and 30; and players still shooting well after hitting the age of 32 often can continue shooting at a relatively consistent pace for at least a few years afterwards, health permitting.
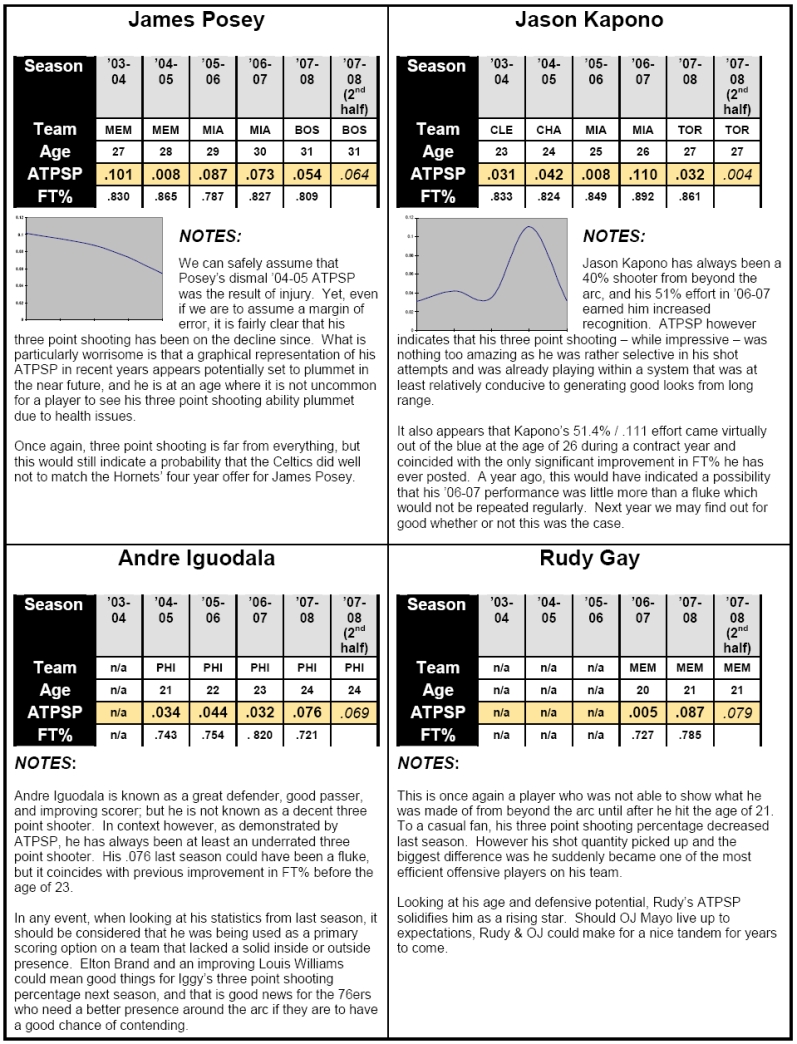
Now, despite what I write above, it was also found that players’ ATPSPs often take a hit when they turn 32 years old, presumably due to physical health issues. Without a full explanation, shooters that have taken a hit – even if it was a relatively small hit - almost immediately after turning 32 over the past four seasons include: Ray Allen, Anthony Parker, Cuttino Mobley, Jason Williams, Mike James, Rasheed Wallace, Derek Fisher, Donyell Marshall, Damon Stoudamire, Tony Delk, Bobby Jackson, and Lamond Murray. Players who will be 32 at the start of next season include Chauncey Billups, Raja Bell, Rafer Alston, Charlie Bell, and Damon Jones – all of whom experienced injury issues last season.
It is also assumed, and often backed up with statistics, that yearly improvement in FT% among younger players indicates that a player has been working on his shot.
Areas for Improvement
While ATPSP appears to do a very respectable job of rating three point shooters, it is inevitably an imperfect statistic that can be improved upon.
The biggest issue I have with ATPSP currently is that there is no consistent method of forming accurate team multipliers for players who either play for more than one team during a season, or miss games due to injury. A player might only play forty games during a given season, but his team multiplier is based on all eighty two games his team played. In an ideal sense, it might be worthwhile to strictly use a player’s “on court” statistics when forming team multipliers, although then players get punished to a larger extent for making their team better. This is a subject for discussion.
Also, given the current formula, a player’s overall offensive efficiency is compared relative to his teammates’ efficiency without regard to whether or not a player often shared the court with certain teammates. For example, a player who gets most of his minutes alongside second-stringers may be unfairly penalized because his overall offensive efficiency was lower than that of his team’s first-stringers. Now I do assume that playing against the opposition’s second stringers helps to balance this effect, but once again there is certainly room for debate here.
Lastly, with the right spreadsheets available, it would be interesting to see how various factors that I have not examined can help predict trends in a player’s three point shooting ability. I do believe that would be beneficial to look over historical ‘second half of a season’ stats, as well as college and high school stats.
Bill Goldblatt is a 27 year old small business owner currently residing in Phoenix, Arizona. Professionally, he is an expert in fields related to both market and patent research, and holds a background largely relevant to small business management and entrepreneurship. On the side, he is a Celtics fan and a sports fan with a working knowledge of Microsoft Excel. He can be reached @ bgoldblatt@gmail.com with any questions or comments.