|
|
||||||||||||||||||||||||||||||||||||||||||||||||||||||||||||||||||||||||||||||||||||||||||||||||||||||||||||||||||||||||||||||||||||||||||||||||||||||||||||||||||||||||||||||||||||||||||||||||||||||||||||||||||||||||||||||||||||||||||||||||||||||||||||||||||||||||||||||||||||||||||||||||||||||||||||||||||||||||||||||||||||||||||||||||||||||||||||||||||||||||||||||||||||||||||||||||||||||||||||||||||||||||||||||||||||||||||||||||||||||||||||||||||||||||||||||||||||||||||||
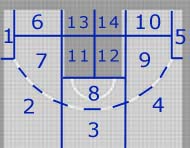
Game Charting Insights: Event LocationsAnother key piece of general NBA knowledge that's been missing is the location on the court of fouls, particularly those leading to free throws, as well as where turnovers are occurring. With this information, combined with shot locations, we can accurately portray the expected "points per possession" from different parts of the floor, and better understand the implications arising from this.Project scope: we tracked the beginning and end location for possession events (shot, foul, turnover).
So if on a play a guy catches a pass in zone 4 and then drives down to zone 10 for the shot, then the shot comes with a 4 start zone and 10 end zone.
** Shooting Foul, Foul and Turnover percentages are expressed as a percentage of possessions for the zones in question The most lethal spot on the floor? That would be in the corner for the short three pointer! Now of course our sample may not represent very well a full season of play, so it's clear that the money zone is basically in the "deep paint" right underneath the hoop, but the corner three territory is also important. In terms of where fouls occur that depends a bit on if you limit it to just shooting fouls or all (defensive) fouls. For shooting fouls, you're looking at the in the paint zones, where the vast majority of physical contact occurs, there are however a lot of non shooting fouls that occur in the two point jumper zones and behind the three point line. Turnovers are infrequent deep in the paint (since there's not a lot of dribbling), but fairly constant in all other zones excluding the almost pure catch and shoot corner threes (95% of the corner threes are assisted). Let's look at the distribution of events a bit more closely:
So for those people lamenting the NBA is just endless three pointers or slam dunks, we could counter that in fact there's an almost "perfect balance" with a near 50/50 split between the number of possession events taking place inside the paint, and outside the paint! Of course 90% of the shooting fouls do occur in the paint, but not with a similarly lopsided turnover rate, although it should be noted that with passing turnovers we were charting the location of the passer when he threw the ball for this exercise, not the zone of the intended receiver of the pass. All right, that's the end point -- the actual location -- of possession events. What about the starting point though, where the player got the ball on route to the action?
So in general the expectations are pretty similar on a league wide look getting the ball in most zones, with the exceptions again being the close in zones 13 & 14, as well as the corner three's where catch and shoot is the order of the day. Otherwise starting a move from the wings is slightly less optimal, but this varies considerably from player to player. Could it be very valuable to teams to have charts like the above for specific players? Ah, now that would be telling... Moving on then, another logical area to look at is what happens when a player starts in a certain zone and then moves to another zone for the event.
Zone Movement with the ball during a Possession
Some interesting things turn up. When a player with the ball starts in a three-point zone, the most efficient move he can make is none at all -- shooting a three works out better overall than moving in for a two point jumper or even driving into the paint. When a player gets the ball in Two-Point Jump Shot territory, the most success has come from backing up and taking a three! When a player gets the ball in the paint, if we discard the tiny sample where the player winds up shooting from long distance, then looking to score inside is the best basic scenario. What's the common thread in all this? Two-point jump shots stink on a league wide basis. So yes in some ways the complaint that "three's and dunks" dominate play in the NBA is true -- the two most effective options on offense are trying to score/draw the foul in the paint, or getting a good look from behind the line where the extra point payoff makes such a difference. One last point we'll address in this article is that despite the angst often heard when players take a pass and go up with the shot right away ("they shouldn't settle for that shot..."), the reality is players in the NBA are more efficient overall when they don't change zones after receiving the ball: Possessions that begin and end in the same zone
Looking at league wide averages tells us a lot about the nature of NBA basketball, but of course there are many individual players who defy the conventions and norms, so we're not suggesting Dwyane Wade should give up trying to beat his man off the dribble! No, rather this is a first look at some general rules about what the value is in having the ball in a player's hands at a given point on the court. The variance from player to player though can be enormous!
Also see: Game Charting: The Value of a Good Pass (03/20)
Game Charters for the "Floor Location" Project:
Thanks as always to the noble efforts of the charters -- they are the ones who will be pushing NBA statistical analysis to new heights!
Interested in doing some game charting? Send a message to:
charting@82games.com
|
||||||||||||||||||||||||||||||||||||||||||||||||||||||||||||||||||||||||||||||||||||||||||||||||||||||||||||||||||||||||||||||||||||||||||||||||||||||||||||||||||||||||||||||||||||||||||||||||||||||||||||||||||||||||||||||||||||||||||||||||||||||||||||||||||||||||||||||||||||||||||||||||||||||||||||||||||||||||||||||||||||||||||||||||||||||||||||||||||||||||||||||||||||||||||||||||||||||||||||||||||||||||||||||||||||||||||||||||||||||||||||||||||||||||||||||||||||||||||||
|
|
Copyright © 2006 by 82games.com, All Rights Reserved